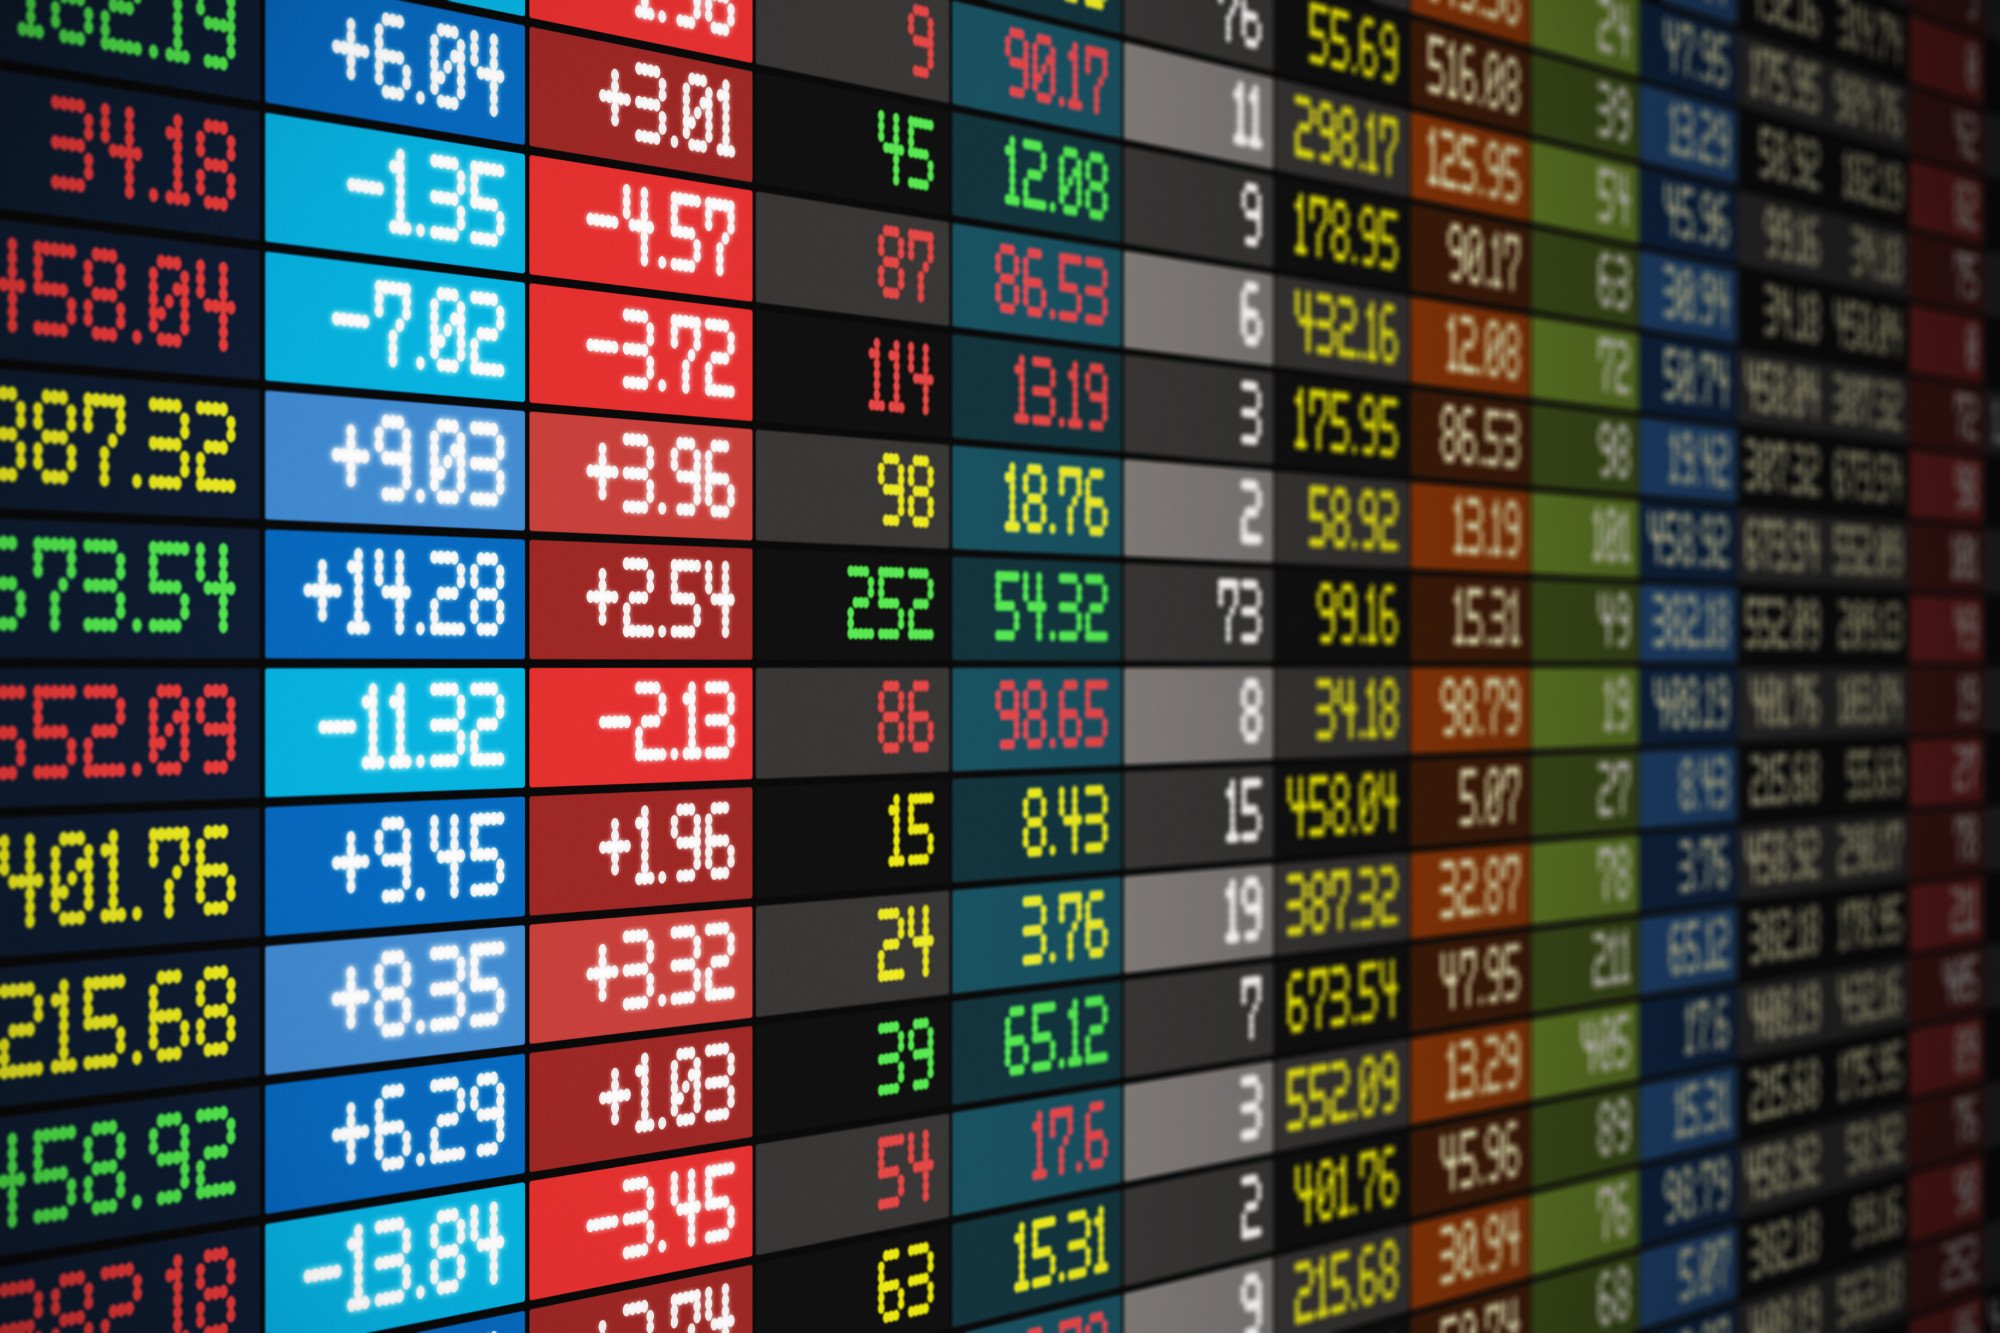
Stocks Market Basics 101: How to Read a Stock Table
You’ve seen all of the movies about big player investors and you want to be just like those guys. Buy low, sell high, and make a killing.
If you’re just getting started in the world of investing, there are some basics that you need to know. That starts with being able to read a stock table. Then you can be part of the 54% of Americans who own stock in the markets.
Read on to learn how you can read stock market tables.
The Major Stock Markets
Go to Google Finance. The first step in reading a stock table is to understand where it’s traded. That will give you a lot of information about the stock.
The New York Stock Exchange is the biggest stock market in the world, claiming over 40% of the world’s market value.
You’ll hear terms like Dow Jones and S&P 500 as well. These are indices that track the performance of specific stocks. These indices are supposed to indicate the health of the markets.
Nasdaq is a combination of an index and a stock exchange that offers about 3000 stocks. These are usually technology companies like Alphabet and Apple.
What Are the Trends?
The next thing that you’ll look at is the graph of the stock’s performance over the last day. You can change the view to view the last week, month, year or 5 years.
You’ll see noticeable trends as to whether or not the stock has been consistently climbing up or down. If there are major dips or increases, you can do further research to find out if there was news that corresponds with those shifts.
Stock Table Terminology
There will be a host of more information underneath that chart. There are abbreviations and terms to know.
Open: The price of the stock when the markets opened at 9:30 am EST.
Close: The price of the stock when the markets closed the previous day.
Bid: What the market is willing to pay for the stock.
Ask: The price of the stock the seller will accept.
Note that if there’s a big discrepancy between the two, you’ll know if there’s a lot of supply or high demand of the stock.
52 Week High/Low: This is an indicator of the stock’s performance over the last year. If there’s a big jump in stock price, it’s an indication that there’s been a lot of growth in the company.
P/E Ratio: This is the price to earnings ratio. Take the price of the stock and divide it by the earnings per share. In an ideal case, you want to buy when the P/E ratio is low and sell high.
Once you know how to read a stock table, you can make predictions and forecasts about the long-term health of a stock. You can practice your stock knowledge by reading predictions and forecasts, like this Alibaba stock forecast.
How to Read a Stock Table Like a Pro
There’s a ton of information hidden in a stock table. With one quick study, you can determine the overall health of a company and find out if that specific stock is among the best stocks to buy right now.
Are you ready to make more money so you can invest it? Check out this suite of resources to get your business off the ground.

