
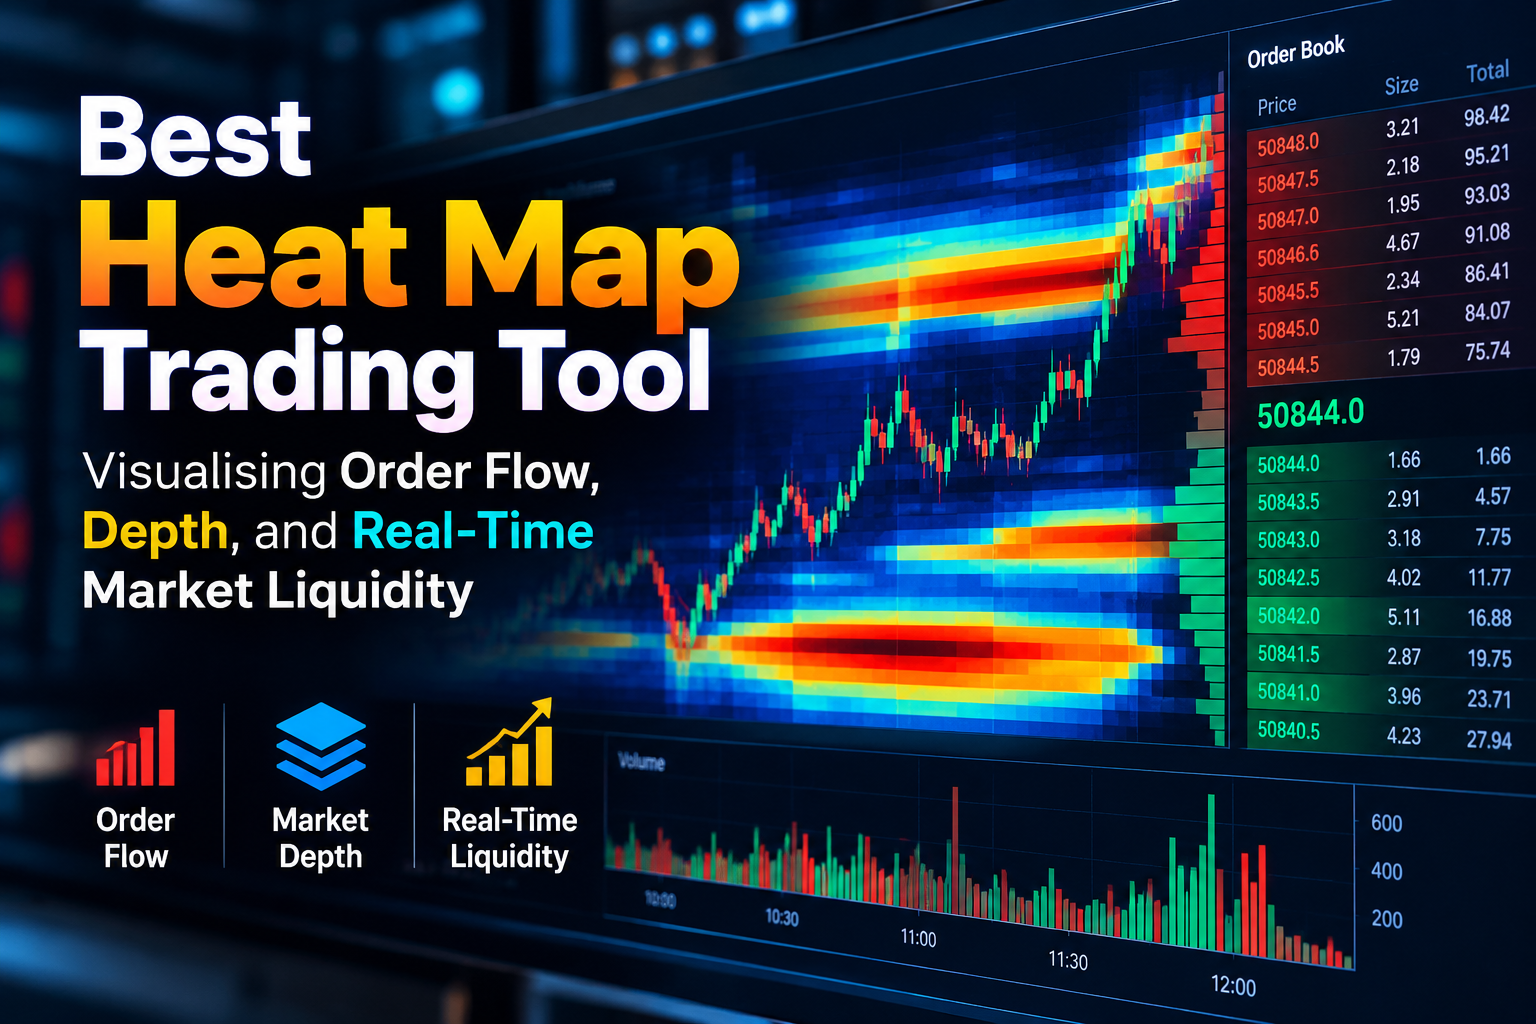
Best Heat Map Trading Tool: Visualising Order Flow, Depth, and Real-Time Market Liquidity
Quick Summary: What Makes the Best Heat Map Trading Tool?
The best heat map trading tool visualizes the Central Limit Order Book (CLOB) in real time, converting raw Level 2 and Level 3 market depth data into an intuitive, color-graded visual timeline. Unlike traditional candlestick charts that show only past transactions, a true order book heatmap reveals resting limit orders (liquidity pools), order modifications, cancellations, and aggressive volume absorption. By visualizing where institutional liquidity sits before price arrives, traders gain objective context on support and resistance. At Bookmap, we provide the industry benchmark in visual market depth, streaming unthrottled exchange data into a patented time-and-price heatmap that lets you trade with precision and clarity.
Futures Trading Software
Futures trading software has evolved through several technological generations. Early electronic platforms focused on basic chart plotting and quote boards. As execution speeds accelerated, trading desks adopted numerical Depth of Market (DOM) ladders and footprint charts to read order flow.
Today, advanced futures trading software focuses on latency reduction, unthrottled data processing, and visual microstructure analysis. Because modern electronic auctions are dominated by algorithmic execution and high-frequency trading (HFT), market participants can no longer rely solely on lagging indicators. Modern platforms must process hundreds of thousands of order updates per second without freezing or dropping ticks, giving traders a direct look at the continuous auction.
Active participants ready to upgrade their technical architecture can get started with advanced visualization software configured for direct CME and Eurex data feeds.
Order Flow Visualization Platforms
Order flow visualization platforms eliminate the guesswork of traditional technical analysis by charting the raw mechanics of supply and demand:
● Aggressive vs. Passive Orders: Standard price charts treat all volume equally. Visualization platforms separate passive limit orders (which provide market depth) from aggressive market orders (which cross the bid-ask spread to consume liquidity).
● Volume Delta Profiling: Visualizing the net difference between aggressive buying and aggressive selling highlights whether buyers or sellers are exerting initiative pressure.
● Absorption Signatures: When massive aggressive market volume hits a level but fails to move price, visual order flow tools highlight this as absorption, signaling that an institutional limit order wall is holding firm.
By showing these dynamics visually, modern platforms turn complex market microstructure into clear, actionable patterns.
Market Depth Analysis Tools
Market depth analysis tools display the queue of resting limit orders residing at price tiers above and below the inside spread.
Evaluating market depth helps traders answer three critical questions:
-
Where Is Genuine Institutional Liquidity? Large limit orders create structural barriers that price must either absorb or bounce away from.
-
Where Are the Liquidity Voids? Gaps in the order book indicate areas where price can move rapidly with minimal volume resistance.
-
Are Orders Being Added or Pulled? Watching liquidity adjust in real time reveals whether institutional participants are defending their levels or cancelling orders to allow a breakout.
Rather than trying to track fast-flickering numbers on a static screen, the best market depth tools plot this data as an evolving visual history.
Top Order Book Heatmap Software for Futures
Selecting top order book heatmap software for futures requires evaluating how each platform processes high-density exchange feeds:
● Unthrottled Data Streaming: Many web-based charting platforms throttle data updates to 1-second snapshots, hiding critical sub-second order book shifts. Top platforms process every tick directly from direct-market-access (DMA) feeds.
● Configurable Heatmap Contrast: Traders need customizable color gradients to distinguish between routine retail limit orders and massive institutional liquidity walls.
● Historical Depth Retention: A high-quality heatmap does not wipe the screen clean when price moves; it maintains a visual record of historical liquidity, showing how the order book reacted during prior tests.
Bookmap is widely regarded as a market-leading platform in this category, offering a patented visual heatmap engine engineered to handle high-volume futures markets without latency drag.
Best Futures Liquidity Heatmap Platforms
When comparing the best futures liquidity heatmap platforms, active traders generally consider three primary solutions:
-
Bookmap: The pioneer of continuous visual order book heatmaps. It renders resting limit orders alongside executed volume bubbles, offers automated iceberg detection, and supports Level 3 Market by Order (MBO) data.
-
Sierra Chart: A robust, C++ optimized platform popular among quantitative traders, offering customizable footprint charts, DOM ladders, and heatmap studies.
-
ATAS (Advanced Time And Order Flow): An order flow platform providing volume profile tools, cluster charts, and depth visualization tailored for European and US futures.
While each platform has strengths, Bookmap sets the industry standard for graphical depth rendering, delivering an intuitive user experience without requiring complex coding.
Recommended Market Depth Visualizers for Futures Trading
To choose the right market depth visualizer for futures trading, consider your specific analytical workflow:
● For Scalpers and Intraday Momentum Traders: Choose a visualizer that integrates real-time executed volume bubbles with dynamic resting liquidity lines, allowing you to react to liquidity sweeps instantly.
● For Multi-Day Swing Traders: Look for platforms that support historical market depth replay, enabling you to study structural liquidity zones formed over previous sessions.
● For Quantitative and Algorithmic Traders: Select a tool with robust API connectivity that allows you to build custom indicators and automate order routing based on order book imbalances.
Traders looking to configure an optimal visual workspace can speak to an expert for technical guidance.
CME Futures Level 3 Market Depth Heatmap Indicators
CME Market by Order (MBO) data, commonly known as Level 3 data, provides individual order attributes and exact queue positions within the Limit Order Book.
Level 3 market depth heatmap indicators provide unique advantages:
● True Queue Positioning: Track your limit order’s exact position in line at the exchange matching engine under Price-Time Priority (FIFO) rules.
● Individual Order Size Tracking: Differentiate between a single 500-contract institutional order and twenty-five 20-contract retail orders resting at the same price tier.
● Automated Iceberg Detection: When an institutional participant deploys an algorithmic iceberg order to hide size, Level 3 indicators detect the reload signatures and display them directly on the chart.
Using Bookmap with CME MBO data allows traders to visually track iceberg orders and monitor institutional participation with unmatched precision.
Real Time Order Book Heatmap for E Mini S and P 500
The E-mini S&P 500 (ES) is the global benchmark for index futures, characterized by a thick, highly liquid Limit Order Book.
Trading ES on a real-time order book heatmap provides distinct advantages:
● Identifying Thick Liquidity Shelves: ES order books frequently feature hundreds or thousands of resting contracts per tick. A visual heatmap makes these support and resistance zones obvious.
● Tracking Absorption at Key Levels: When high volume delta prints at a prior session high but price fails to tick upward, the heatmap reveals the resting sell wall absorbing the aggressive buyers.
● Spotting Spoofing and Pulling: If a 2,000-contract limit order appears at a major level but vanishes right before price arrives, the heatmap highlights the cancellation, warning you not to trade the false breakout.
Visualizing these dynamics in ES helps traders avoid retail traps and align their execution with institutional volume.
Futures DOM Heatmap Software Mac Compatible
Many professional order flow platforms are built strictly for Windows, presenting challenges for macOS users. If you need futures DOM heatmap software that is Mac compatible, here are the primary paths:
● Native Cross-Platform Architecture: Bookmap runs natively on macOS (including Apple Silicon M1/M2/M3 chips) via its optimized Java runtime engine, providing high-performance depth rendering without virtual machines.
● Virtual Private Servers (VPS): Many traders run Windows-based order flow tools on a dedicated, low-latency Windows VPS, accessing their workspace via Microsoft Remote Desktop on Mac.
● Virtualization Software: Running Parallels Desktop or VMware Fusion allows macOS users to run Windows trading tools, though native applications remain preferred for latency-sensitive execution.
Choosing a platform with native macOS support ensures smooth performance during volatile market sessions.
How to Use a Heatmap for Futures Trading
Using a heatmap effectively requires a structured, step-by-step analytical framework:
-
Identify the Major Liquidity Pools: Before the session opens, inspect the heatmap to locate bright horizontal bands representing concentrated resting limit orders.
-
Observe Price Approach Velocity: Watch how price behaves as it nears a liquidity band. If price accelerates smoothly toward the level, the resting liquidity is acting as a price magnet.
-
Look for Absorption vs. Sweeps:
○ If large volume bubbles print at the liquidity band and price stalls, absorption is occurring; prepare for a reversal.
○ If price punches through the liquidity band and new limit orders stack up behind it, a liquidity sweep and breakout has occurred; look for trend continuation.
-
Anchor Invalidation to Resting Depth: Place your protective stop-loss directly behind confirmed resting liquidity walls, ensuring the market must consume institutional size to stop you out.
-
Target Opposing Liquidity Pools: Set profit targets at visible resting liquidity bands on the other side of the order book.
Bookmap vs Sierra Chart Heatmap Comparison
Comparing Bookmap and Sierra Chart highlights two distinct approaches to market depth analysis:
|
Comparison Metric |
Sierra Chart |
Bookmap |
|
Primary Visual Philosophy |
Footprint charts, numerical ladders, custom studies |
Patented continuous visual liquidity heatmap |
|
Level 3 MBO Integration |
Supported via specific packages |
Deeply integrated with automated visual iceberg detection |
|
Ease of Use & Learning Curve |
Steep; requires manual chart study configuration |
Intuitive; graphical representation out of the box |
|
Operating System Support |
Windows only |
Cross-platform (Windows & Native macOS) |
|
Historical Market Replay |
Available via continuous chart data |
High-precision tick-by-tick replay engine with speed controls |
|
Best Suited For |
Quantitative developers and system backtesters |
Discretionary, scalping, and visual order flow traders |
While Sierra Chart provides advanced scripting capabilities for quantitative traders, Bookmap offers superior visual clarity, making real-time liquidity intuitive and actionable.
Best Free Order Flow Heatmap Tools for Futures
Traders exploring free order flow tools should understand their capabilities and limitations:
● What Free Tools Can Do: Basic browser-based heatmaps and free indicators on platforms like TradingView can show historical volume profiles and static liquidity snapshots.
● What Free Tools Cannot Do: They cannot process unthrottled Level 2 and Level 3 order book updates, track microsecond queue changes, or detect algorithmic iceberg orders in real time. Full order book feeds require direct exchange connections that carry data licensing costs.
● The Practical Free Option: Bookmap Digital is completely free to use with real-time cryptocurrency data from major digital exchanges, allowing traders to master heatmap analysis and order flow mechanics before subscribing to paid futures data feeds.
Are You Looking for Free Web Tools or Standalone Desktop Trading Software?
Clarifying your operational requirements determines the right software architecture:
● Free Web Tools: Suitable for casual market monitoring and general volume overviews. However, browser environments face memory limitations and data throttling that make precise order flow analysis difficult.
● Standalone Desktop Software: Essential for serious futures day traders. Dedicated desktop applications utilize multi-core processors, dedicated graphics cards, and unthrottled API connections to render hundreds of thousands of order updates per second without lag.
Professional order flow execution requires desktop software capable of handling dense exchange feeds during volatile market events.
Which Specific Futures Contracts or Asset Classes Are You Analyzing?
Different futures contracts exhibit distinct liquidity profiles that shape how heatmaps appear:
● Equity Index Futures (ES, NQ, YM, RTY): ES features thick, dense order books ideal for absorption strategies. NQ features thinner books with wide price sweeps, making liquidity voids critical to watch.
● Commodity Futures (Crude Oil CL, Gold GC): Highly sensitive to macroeconomic catalysts, showing rapid order book pulling and widening spreads during news releases.
● Treasury and Interest Rate Futures (ZB, ZN): Massive order book depth trading under Pro-Rata or FIFO matching algorithms, where queue position tracking is vital.
Selecting your primary asset class helps ensure your workspace contrast and depth parameters are calibrated correctly.
Do You Need Automated Execution Features or Pure Market Depth Visualization?
Understanding your execution style helps determine the appropriate platform setup:
● Pure Market Depth Visualization: Many traders run a heatmap tool on one monitor for high-resolution visual context while executing trades directly through their existing broker interface or specialized DOM.
● Integrated Automated Execution: Other traders prefer one-click chart trading directly from the heatmap, using bracket orders, automated trailing stops, and custom API bots that trigger trades based on order book imbalances.
Bookmap supports both workflows, functioning as a standalone visual analytical tool or as an integrated, low-latency execution platform connected directly to your broker.
5 Essential Signals to Look for on an Order Book Heatmap
-
Liquidity Walls (Support & Resistance): Bright, persistent horizontal bands indicating concentrated limit orders where price is likely to react.
-
Volume Absorption Bubbles: Large transaction bubbles appearing at a liquidity level without price moving through it, signaling institutional accumulation or distribution.
-
Liquidity Voids: Dark horizontal zones where resting orders are thin, indicating areas where price can accelerate rapidly.
-
Order Book Spoofing: Thick limit order bands that vanish abruptly as price approaches, warning that the apparent support or resistance was not genuine.
-
Liquidity Sweeps: Fast price spikes that consume resting stop-loss orders beyond a key level before immediately reversing back into balance.
Analytical Workflow Comparisons: Traditional DOM Ladders vs Visual Heatmaps
Comparing traditional price ladders with visual heatmaps illustrates the advantage of continuous graphical depth:
|
Feature / Metric |
Traditional Numerical DOM Ladder |
Visual Order Book Heatmap (Bookmap) |
|
Data Scope |
Flashing numbers at discrete price tiers |
Continuous time-and-price visual heatmap |
|
Historical Context |
None; order numbers vanish when updated |
Complete visual record of liquidity additions and cancellations |
|
Cognitive Load |
High; requires memorizing and tracking fast numbers |
Low; intuitive color gradients show depth instantly |
|
Iceberg Detection |
Requires manual calculation of tape prints vs. depth |
Automatically detected and flagged on the chart |
|
Execution Precision |
Good for fast order entry |
Combines visual order book context with one-click trading |
Platform Pricing and Access Options
Bookmap provides transparent subscription packages structured to support traders across every stage of development:
● Bookmap Digital (Free): Tailored for digital asset traders, featuring real-time crypto order book heatmaps and core volume indicators across major crypto exchanges.
● Bookmap Global ($49/month or discounted annual billing): Designed for active equity and futures day traders, featuring third-party broker integrations, volume delta tools, and customizable order flow modules.
● Bookmap Global+ ($99/month): Our comprehensive institutional-grade solution, offering high-precision historical market replay, automated iceberg detectors, custom API connectivity for algorithmic trading, and priority technical support.
Traders interested in custom configurations can book a consultation to review individual operational requirements.
UK and International Accessibility
Low-latency visual order flow analytics should remain dependable regardless of your geographic location. Bookmap operates on global high-speed data architecture, delivering dependable execution access across the United Kingdom, Europe, North America, and the Asia-Pacific region:
● UK & European Connectivity: Full compatibility with leading brokerages complying with UK FCA and European regulatory regimes, offering clean data feeds for London Stock Exchange equities, Eurex contracts, and US markets.
● Flexible Operating Environments: Run locally on high-performance desktop machines or deploy on low-latency Virtual Private Servers (VPS) for consistent remote connectivity.
● Broad Data Provider Support: Compatible with top-tier financial data feeds including Rithmic, CQG, dxFeed, Interactive Brokers, and major cryptocurrency exchanges.
Why Choose Bookmap
Bookmap is widely regarded as a market-leading platform for visualising order book liquidity and market microstructure:
● Proven Technical Expertise: Built by quantitative developers and seasoned market professionals, Bookmap handles dense order updates per second without lagging or dropping data.
● Actionable Execution Clarity: Instead of guessing where institutional support sits, our patented heatmap visually charts genuine resting volume directly on your screen.
● A Groundbreaking Visual Approach: While standard charts show past prices, Bookmap reveals resting liquidity—the hidden limit orders that dictate future price movement.
● Speed and Execution Advantage: Make faster, more confident decisions around volatile market events by monitoring order book liquidity sweeps as they happen.
Elevate your trading strategy and prepare for real-time market depth analysis: get started with Bookmap today.
Verified User Evidence and Trustpilot Reviews
Platform reliability and data integrity are essential for active traders. Bookmap is trusted by retail traders, proprietary desks, and institutional trading firms globally:
● Strong Trustpilot Reviews: Verified user testimonials on Trustpilot consistently praise Bookmap, where the platform holds an “Excellent” rating (4.4 out of 5 across more than 600 independent customer reviews) for software reliability, order book clarity, and responsive customer support.
● Empirical Trade Verification: Every price line, volume bubble, and liquidity cluster reflects direct exchange trade prints. There are no lagging algorithms or repainted data points.
● Comprehensive Educational Support: Access extensive video libraries, live market analysis webinars, and an active trader community dedicated to mastering order flow dynamics.
Frequently Asked Questions
What is an order book heatmap in trading?
An order book heatmap is a visual representation of the Limit Order Book over time. It uses a color-graded scale to show the depth and concentration of resting limit buy and sell orders at various price tiers, allowing traders to see where liquidity is stacking or being pulled.
How does Bookmap detect iceberg orders?
Bookmap compares displayed resting limit order size against actual executed trade volume in real time. When aggressive market orders repeatedly execute at a specific price tier without depleting the visible resting liquidity, our algorithms identify the reloading iceberg order and display it on the chart.
Can I use Bookmap on a Mac?
Yes. Unlike many traditional order flow platforms that run exclusively on Windows, Bookmap provides native macOS compatibility, running smoothly on modern Apple Silicon hardware without requiring virtualization software.
What data feed do I need to run a futures heatmap?
To view full market depth for futures, you need a tick-by-tick Level 2 or Level 3 (MBO) data feed from providers such as Rithmic, CQG, or dxFeed, along with appropriate exchange data subscriptions (such as CME Group).
How is a heatmap different from a footprint chart?
A footprint chart shows completed trades (volume transacted at the bid and ask) inside historical price candles. A heatmap displays both completed trades and resting limit orders across time, showing where liquidity waits before price gets there.
Can I backtest heatmap strategies using historical data?
Yes. With Bookmap Global+, you can utilize our market replay engine to download past trading days and replay tick-by-tick order book depth at variable speeds, allowing you to backtest your execution setups without risking capital.
How do I contact the team for personalized platform setup?
You can easily speak to an expert or book a consultation directly through our dedicated support portal. Our technical team is available to assist with data feed configurations, broker setups, and chart layout optimizations.
Discover True Market Transparency with Visual Order Flow
Attempting to navigate modern futures markets using static candlestick charts and lagging indicators leaves you blind to where institutional liquidity actually resides. By tracking resting limit orders, identifying bid-ask dynamics, and observing institutional absorption as it happens, you can trade futures with clarity, precision, and confidence.

